Optimizing Python Trading: Leveraging RSI with Support & Resistance for High-Accuracy Signals | by Aydar Murt | The Capital | Jan, 2025
Once support/resistance trends are validated, the next step is to incorporate RSI to fine-tune trading signals. A unified approach helps identify optimal buy/sell moments.
Code Example:
def generateSignal(l, df, rsi_lower, rsi_upper, r_level, s_level):
trend = confirmTrend(l, df, r_level, s_level)
rsi_value = df['RSI'][l]if trend == "below_support" and rsi_value < rsi_lower:
return "buy"
if trend == "above_resistance" and rsi_value > rsi_upper:
return "sell"
return "hold"
Detailed Explanation:
- Inputs:
l: Candle index for analysis.df: DataFrame containing RSI and market data.rsi_lower: RSI threshold for oversold conditions (default often set around 30).rsi_upper: RSI threshold for overbought conditions (default often set around 70).r_level: Resistance level.s_level: Support level.
2. Logic Flow:
- Determines the trend using the
confirmTrend()function. - Checks the current RSI value for overbought or oversold conditions:
- If the price is below support and RSI indicates oversold, the signal is
"buy". - If the price is above resistance and RSI shows overbought, the signal is
"sell". - Otherwise, the signal remains
"hold".
3. Outputs:
- Returns one of three trading signals:
"buy": Suggests entering a long position."sell": Suggests entering a short position."hold": Advises waiting for clearer opportunities.
Apply the support and resistance detection framework to identify actionable trading signals.
Code Implementation:
from tqdm import tqdmn1, n2, backCandles = 8, 6, 140
signal = [0] * len(df)
for row in tqdm(range(backCandles + n1, len(df) - n2)):
signal[row] = check_candle_signal(row, n1, n2, backCandles, df)
df["signal"] = signal
Explanation:
- Key Parameters:
n1 = 8, n2 = 6: Reference candles before and after each potential support/resistance point.backCandles = 140: History used for analysis.
2. Signal Initialization:
signal = [0] * len(df): Prepare for tracking identified trading signals.
3. Using tqdm Loop:
- Iterates across viable rows while displaying progress for large datasets.
4. Call to Detection Logic:
- The
check_candle_signalintegrates RSI dynamics and proximity validation.
5. Updating Signals in Data:
- Add results into a
signalcolumn for post-processing.
Visualize market movements by mapping precise trading actions directly onto price charts.
Code Implementation:
import numpy as npdef pointpos(x):
if x['signal'] == 1:
return x['high'] + 0.0001
elif x['signal'] == 2:
return x['low'] - 0.0001
else:
return np.nan
df['pointpos'] = df.apply(lambda row: pointpos(row), axis=1)
Breakdown:
- Logic Behind
pointpos:
- Ensures buy signals (
1) sit slightly above high prices. - Ensures sell signals (
2) sit slightly below low prices. - Returns
NaNif signals are absent.
2. Dynamic Point Generation:
- Applies point positions across rows, overlaying signals in visualizations.
Create comprehensive overlays of detected signals atop candlestick plots for better interpretability.
Code Implementation:
import plotly.graph_objects as godfpl = df[100:300]  # Focused segment
fig = go.Figure(data=[go.Candlestick(x=dfpl.index,
open=dfpl['open'],
high=dfpl['high'],
low=dfpl['low'],
close=dfpl['close'])])
fig.add_scatter(x=dfpl.index, y=dfpl['pointpos'],
mode='markers', marker=dict(size=8, color='MediumPurple'))
fig.update_layout(width=1000, height=800, paper_bgcolor='black', plot_bgcolor='black')
fig.show()
Insight:
- Combines candlestick data with signal scatter annotations.
- Facilitates immediate recognition of actionable zones.
Enrich visual plots with horizontal demarcations for enhanced contextuality.
Code Implementation:
from plotly.subplots import make_subplots
# Extended check
fig.add_shape(type="line", x0=10, ...)  # Stub logic for signal-resistance pair representation
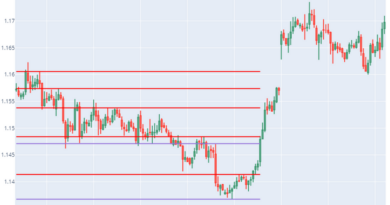
Enhancing the strategy further, we visualize the detected support and resistance levels alongside the trading signals on the price chart.
Code Implementation:
def plot_support_resistance(df, backCandles, proximity):
import plotly.graph_objects as go# Extract a segment of the DataFrame for visualization
df_plot = df[-backCandles:]
fig = go.Figure(data=[go.Candlestick(
x=df_plot.index,
open=df_plot['open'],
high=df_plot['high'],
low=df_plot['low'],
close=df_plot['close']
)])
# Add detected support levels as horizontal lines
for i, level in enumerate(df_plot['support'].dropna().unique()):
fig.add_hline(y=level, line=dict(color="MediumPurple", dash='dash'), name=f"Support {i}")
# Add detected resistance levels as horizontal lines
for i, level in enumerate(df_plot['resistance'].dropna().unique()):
fig.add_hline(y=level, line=dict(color="Crimson", dash='dash'), name=f"Resistance {i}")
fig.update_layout(
title="Support and Resistance Levels with Price Action",
autosize=True,
width=1000,
height=800,
)
fig.show()
Highlights:
- Horizontal Support & Resistance Lines:
supportlevels are displayed in purple dashes for clarity.resistancelevels use red dashes to signify obstacles above the price.
2. Candlestick Chart:
- Depicts open, high, low, and close prices for each candle.
3. Dynamic Updates:
- Automatically adjusts based on selected data ranges (
backCandles).


